Test flakiness is annoying. It might be the most expensive thing in your development process. Costs of CI minutes or even test creation might not reach the cost of time spent on debugging and figuring out what went wrong in interaction between your end to end test and your app code.
This is why dealing with test flakiness can get exhausting and has a reputation of being one of the most annoying and boring parts of QA/dev job. When tests are flaky for long enough, people tend to get “alarm fatigue” and just let the test retry and hope for the best. But hope is not a strategy.
As the number of retries and flaky tests go up, risk goes up as well. No wonder why so many testers are not really fans of test retries - they can cover up some underlying problems. One example of a high-risk problem that can be covered by a test retry is a false positive.
A false positive happens when a test should fail, but instead it passes. A common saying in testing world says: “Never trust a test you haven’t seen fail”. False positive can indeed happen when it’s not properly written, but sometimes it might happen because of an ignored test flake.
Test flake analysis
This blogpost is a walkthrough of a false positive test flake. The fact that it is a false positive was actually discovered by accident. The test is a very simple one and is focused on a very critical part of web applications - accessibility. A simplified version of a test looks something like this:
typescriptbeforeEach(() => {
  cy.visit('/')
  cy.injectAxe()
})

it('Checks accessibility of a page', () => {
  cy.contains('Loading').should('not.exist') // make sure page is loaded
  cy.checkA11y()
})
We are utilizing cypress-axe plugin that inserts a custom code to the
<head> tag of visited page, and then calls a function that will check the contents of the DOM for potential accessibility violations. In case of a failing test, the message throws a an error similar to this one: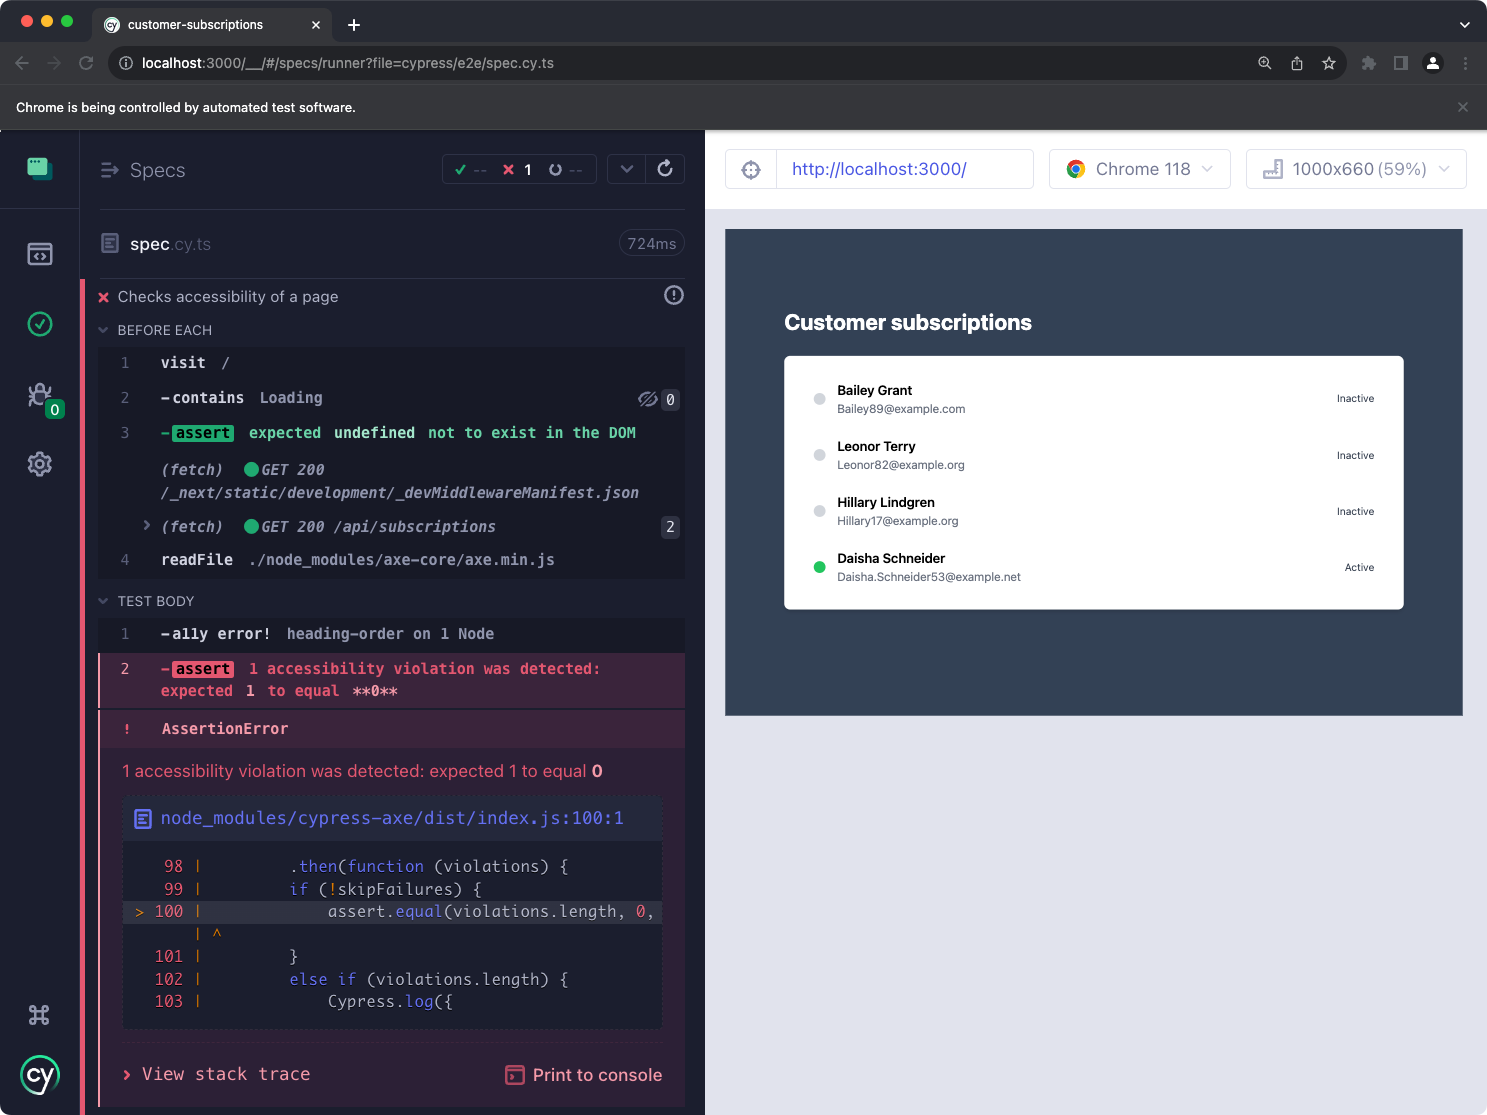
A detailed look into the error will reveal the underlying problem. In our case, an improper heading elements hierarchy was created on our page, jumping from
<h1> straight to <h3> element. cypress-axe plugin will print out the following information into the console and even provide the exact DOM node that created the problem.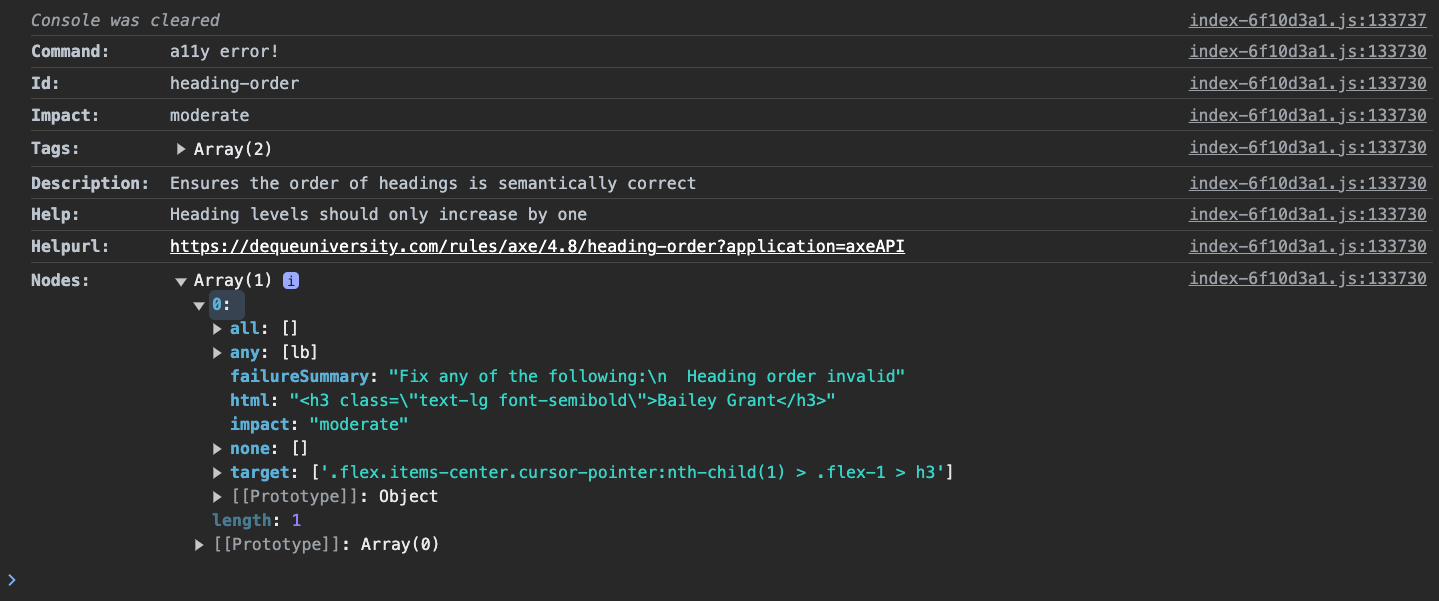
We can easily fix this by updating our
<SubscriptionItem /> component and adding the proper HTML tag:diffimport React from 'react'; import { Subscription } from '../interfaces/subscription'; interface SubscriptionItemProps { subscription: Subscription; onOpenModal: (subscription: Subscription) => void; } const SubscriptionItem: React.FC<SubscriptionItemProps> = ({ subscription, onOpenModal }) => { return ( <div className="flex items-center cursor-pointer hover:bg-slate-100 px-4 py-2 rounded-md" data-cy="customer-item" onClick={() => onOpenModal(subscription)} > <div className={`w-4 h-4 rounded-full mr-4 ${subscription.status === 'active' ? 'bg-green-500' : 'bg-gray-300'}`}></div> <div className="flex-1"> - <h3 className="text-lg font-semibold">{subscription.fullName}</h3> + <h2 className="text-lg font-semibold">{subscription.fullName}</h2> <p className="text-gray-500">{subscription.email}</p> </div> <p className="text-sm text-gray-700 capitalize">{subscription.status}</p> </div> ); } export default SubscriptionItem;
Debugging test flake
The
cypress-axe is going to scan the whole DOM for potential violations so if at any point an element appears that does not have the correct accessibility attributes, this test will fail. When we started looking into this test, it was randomly failing on some occasions which pointed to a violation on the page, but it was not clear what exactly caused it.💡 You can follow this exact case in this replay.
The initial error pointed to a found violation.
Unfortunately,
cypress-axe plugin does not show details on what exactly caused the violation in the error message. The details of this error do not show up in any report.The details of this error do not show up in the report, however we can use Replay DevTools to retroactively inspect the error.
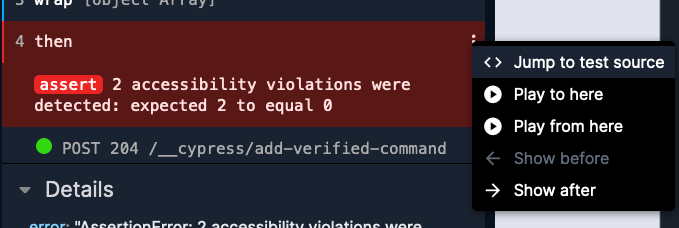
Clicking on “Jump to test source” button will take is directly to the details of
cy.checkA11y() command. Here we can take a look into the accessibility violations by printing out the violations variable. In Replay, you can do this by clicking “+” button that reveals after you hover over the line number on the gutter. A good indication on where to add your print statement are the highlighted light blue indicators.In the console, we can now see all the violations printed out. Looking into these violations reveals information that was previously hidden from us. The error message tells us that there were 2 violations when none were expected, but now we can actually take a look details of these violations.
Let’s back up a little. As I mentioned before, this is a flaky test. So far we have narrowed down our focus only to one of the test attempts. We want to investigate why this test is randomly failing. The best way to do that is by comparing all three test attempts. We can widen our focus and look at the accessibility violations for each test. The narrowed-down view is indicated by the combination of a solid and the dotted line in the timeline (at the bottom of the screen). These regions are currently ignored in the console but can be revealed by clicking on the “set range” icon on the right side of the timeline.

Now that we can see all three test attempts, we can also see the accessibility violations. To improve readability of each test, we can add a label utilizing the
Cypress.currentRetry API (available from Cypress version 12.3.0). 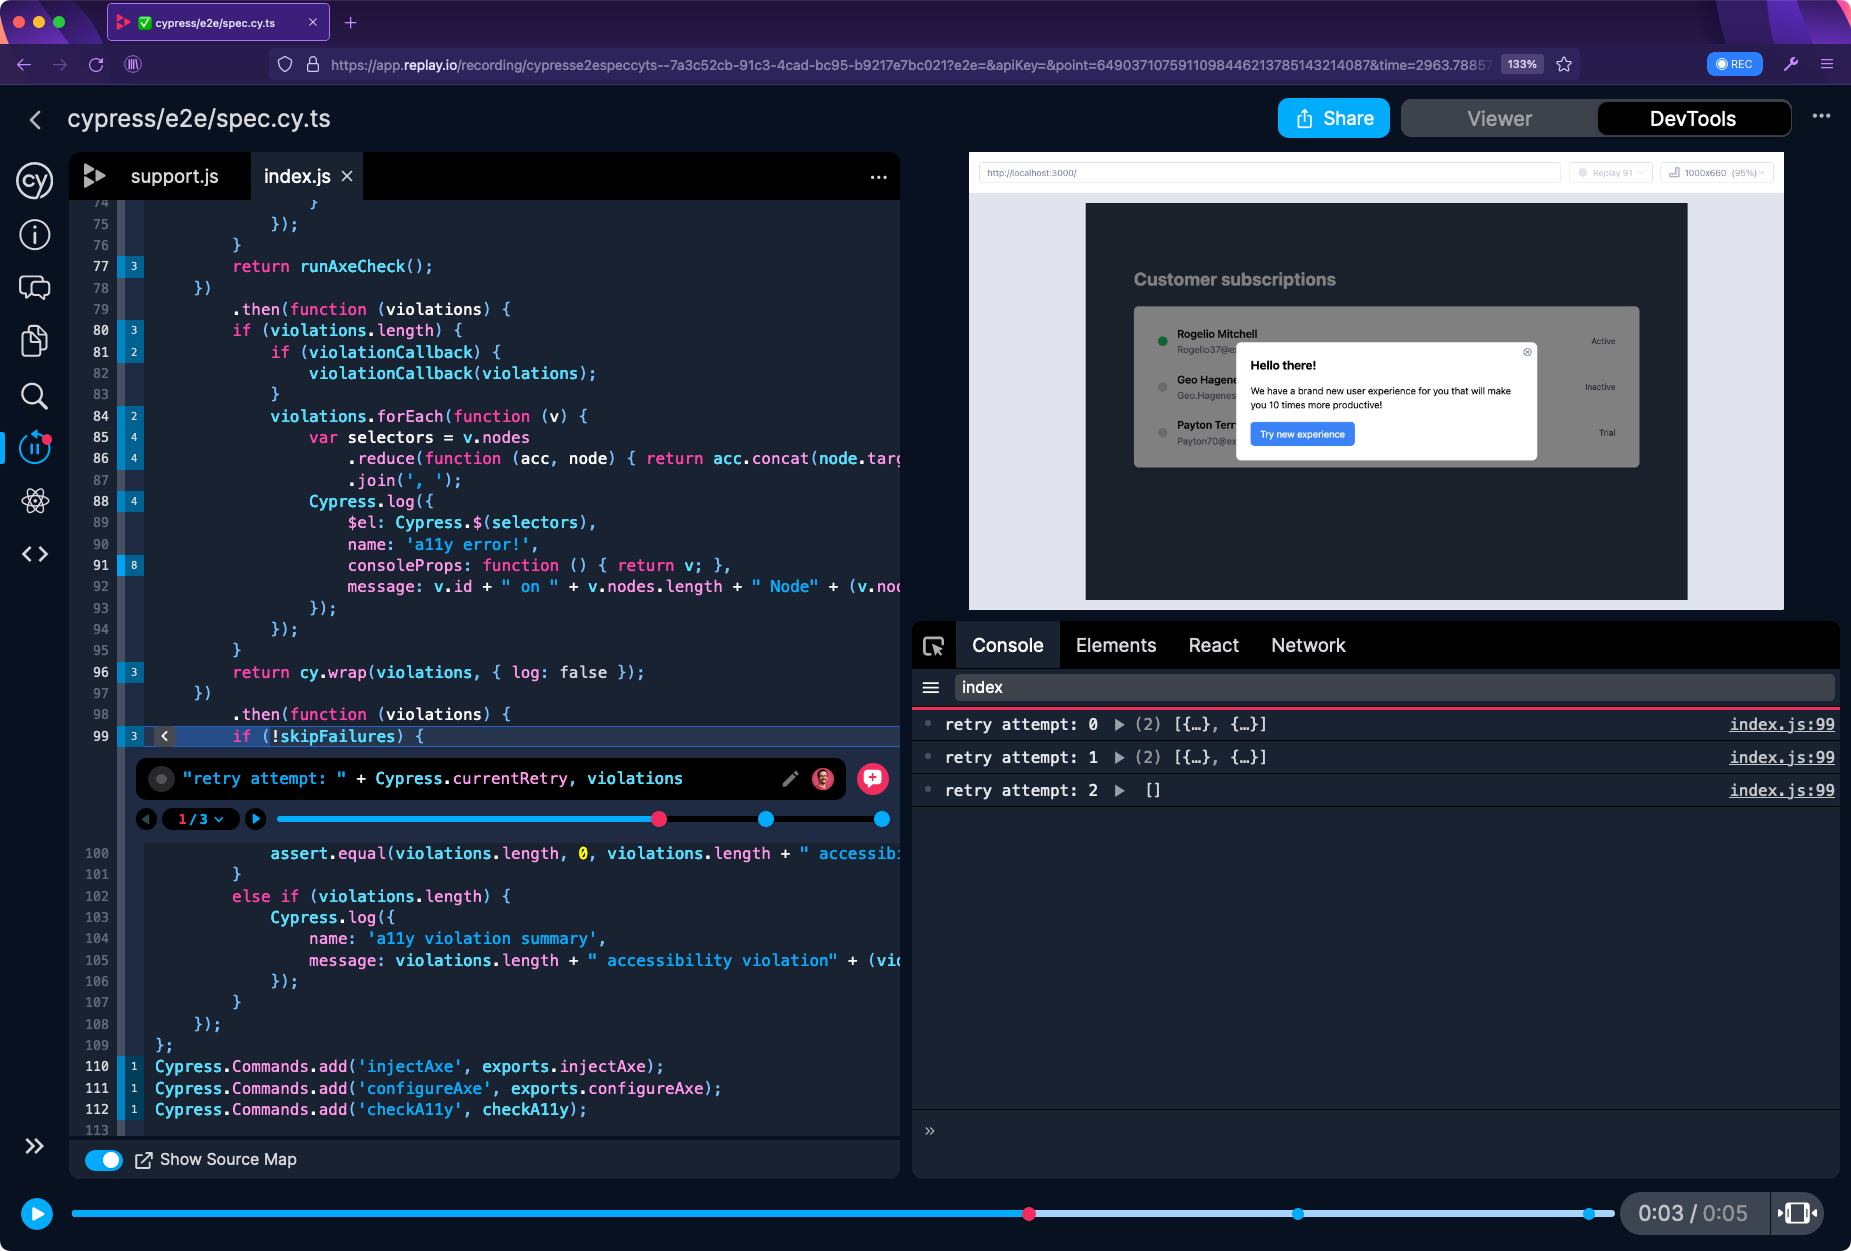
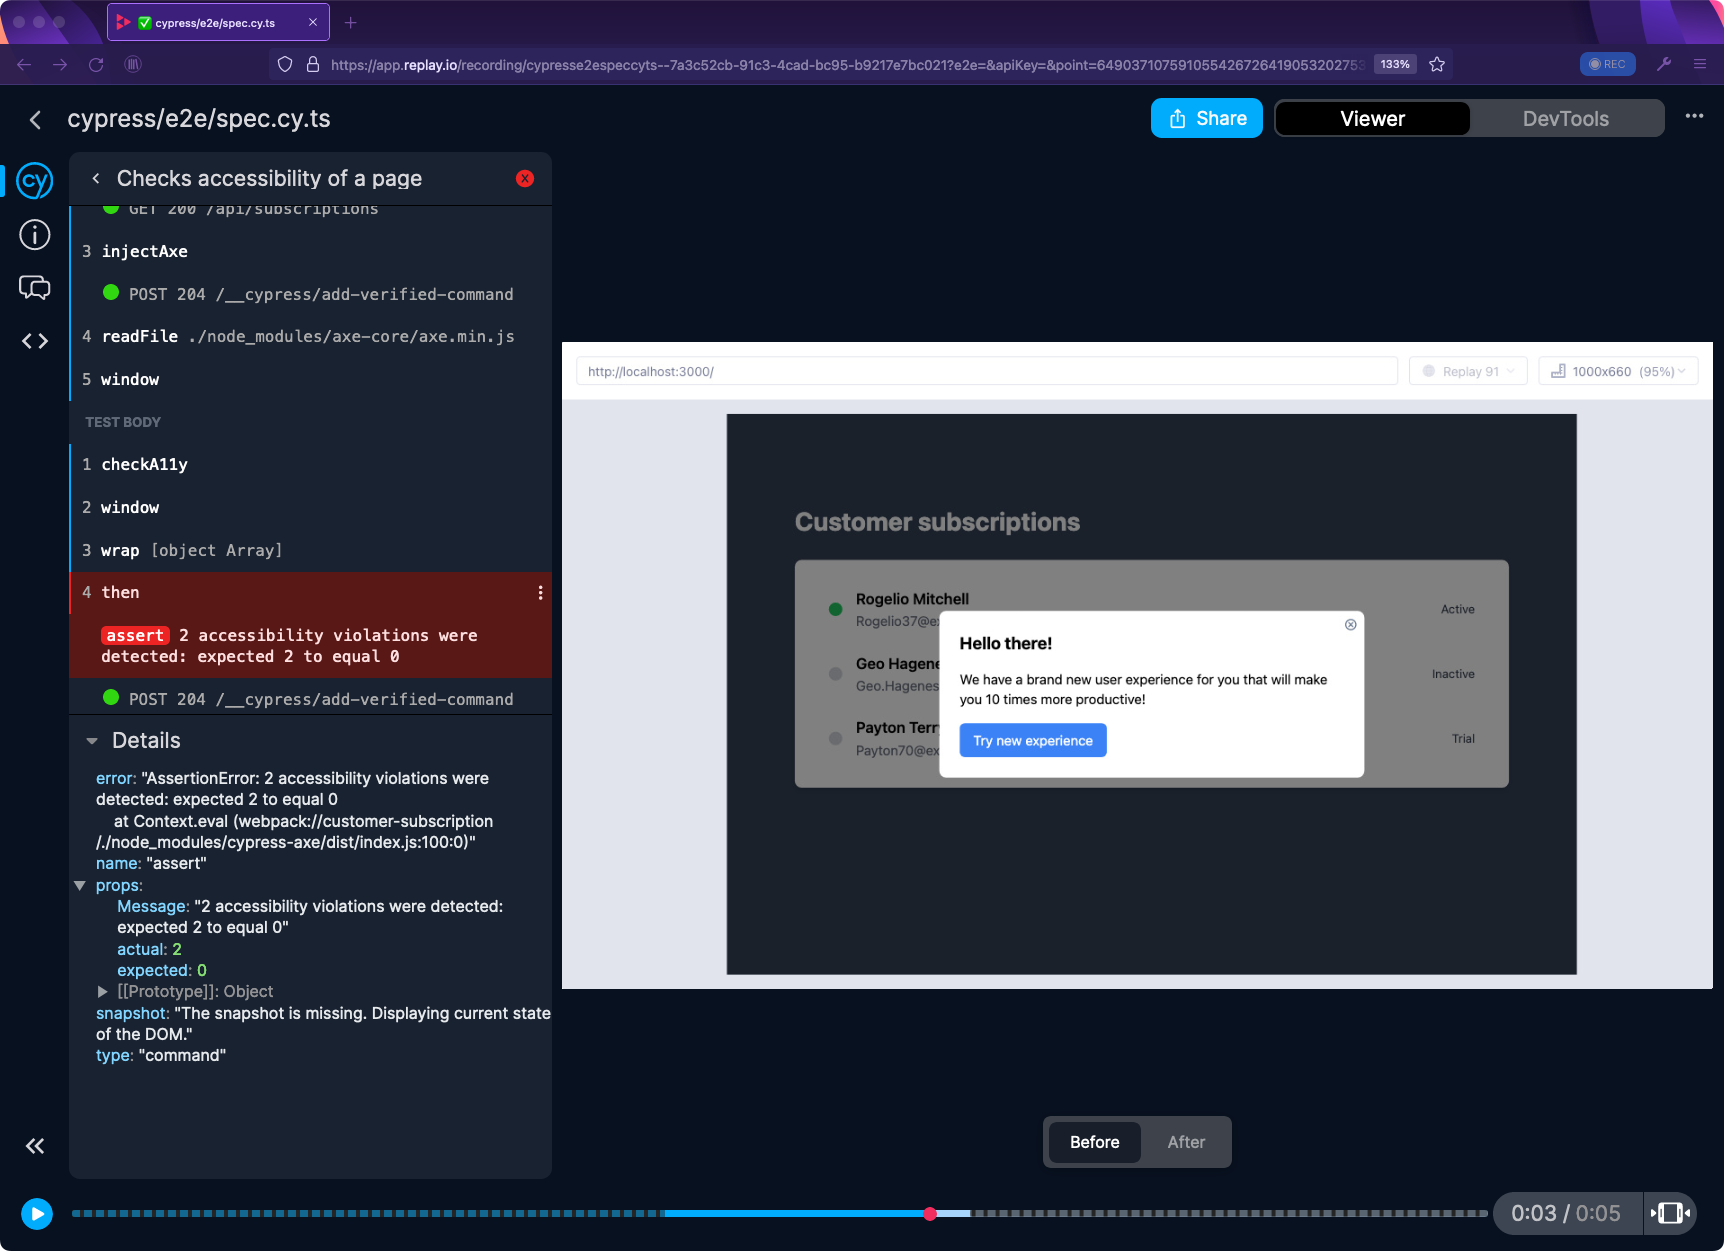
We can now jump in between these test attempts and visually observe any changes that might have occurred in our test. By using ◀️▶️ arrows we can navigate in between the test attempts. This will take us directly to the point where
cy.checkA11y() command checks for violations. This may give us a good clue on why the test is failing.As we can see in the video, a modal window appears in our failed attempts, but it’s missing in the passed attempt. Since the test is failing on accessibility check, there’s a high chance that this modal does not pass these checks and therefore makes our tests fail.
While this is a good assumption, it is definitely worth to validate it. Let’s take a look at one of the violations and examine which part of the application does not pass accessibility checks. By accessing the printed out values inside the console, we can examine
nodes property that will show the problematic element. It seems to be the “Try new experience” button.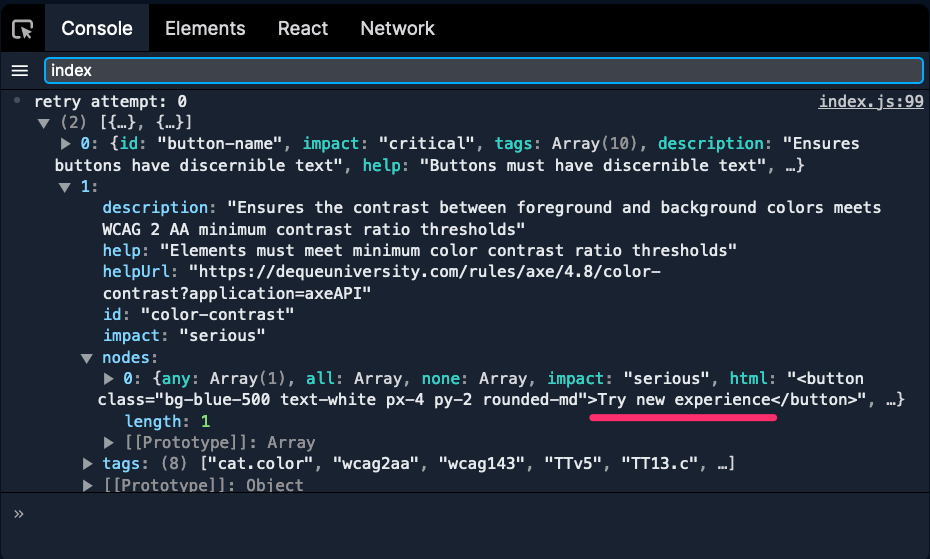
Fun side note - if you we want to double-check presence of this element in our test, we can use a Cypress command right in the console. An internal command called
cy.now() wraps standard Cypress commands which can be called like this: cy.now('contains', 'Try new experience')(). This will work exactly the same as cy.contains('Try new experience'). In our replay, we can jump to any point of time and try calling cy.now() function to check for presence of the “Try new experience button” that’s part of our modal.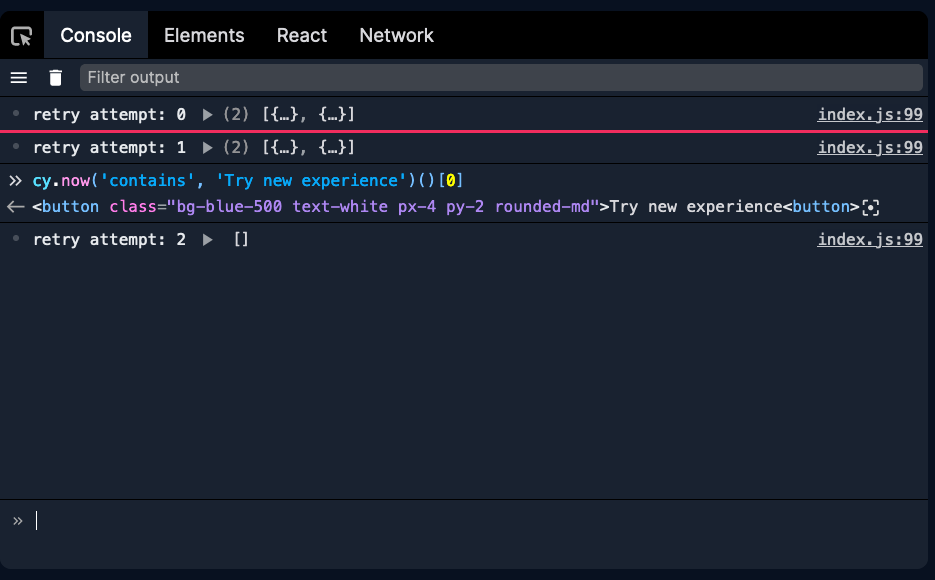
To take this one step further, we can expand our print statement with the
cy.now() command and confirm, that the violation from the cy.checkA11y() command connects to the state of the DOM in our test. The full print statement will look like this: "retry attempt: " + Cypress.currentRetry, violations, cy.now('contains', 'Try new experience')()[0].The printout from the console confirms that in our passed attempt, we are not checking the button that violates the accessibility checks. This will ultimately lead to our test passing, but it’s questionable whether it should.
This test is very similar to many other e2e test flakes. The speed with which e2e tests run on CI tend to reveal timing issues. More often these timing issue can be a sign of a flaky app or unhandled asynchronicity, but as we see in this case, flakiness can be a sign of a legit problem.
Problems like these would normally be really hard to find. But with Replay.io you can travel back in time to any point of test execution and get to details that would normally be hidden. As demonstrated, Replay DevTools provide you more than with timeline of events. You can interactively enter your code and examine its execution.
To try it out, check out our documentation to see how you can create your first recording or integrate Replay into your e2e test suite.